What is Google Analytics?
If you have your own website, then it is important that you understand Google Analytics. However, this particularly useful tool isn’t something that everyone has knowledge on. With this in mind, we have put together our beginner’s guide to Google Analytics, all with the aim to explain more about what it is, and how to use it.
The beauty of Google Analytics is that it is one of the ultimate tools in understanding the performance of your website. Not only this, but it is also entirely free.
However, there are some negative points to Google Analytics, and with so much data to be had, you can find it a challenge to extract everything that you need.
This article sets out to make Google Analytics that little bit easier to understand. It may not delve too deep into the subject, but it does cover the main points and explain them in as much detail as possible.
Data is the key here, and in order to extract the most important data for you, you need to set a date range. This is easy to do, and you can adjust the dates in the top right of the window. Once you have this information set, then you can get to grips with the different reports that you are likely to find within Google Analytics.

How many visits am I getting?
This is possibly one of the biggest things that Google Analytics is used for. After all, you want to make sure that your website is attracting as many customers as possible. There is an Acquisition – Overview screen which will give you a quick insight into your recent performance. Within this screen you will see the following reporting areas:
- A graph that depicts your visitor numbers over time
- The total number of users
- The total number of users that are new to your website and haven’t visited it before
- A realtime indication of how many users are on your website right now
- Events that users have triggered e.g Page Views
- Average engagement time
All of this data is incredibly useful and will give you an insight into your customers and visitors. Whether it is how interested they are in your content (enough to visit your website) or how long they spend looking around your website. These are things that you can use to improve your website, and make sure that it is appealing to your target audience.

It works for you
A great thing of Google Analytics is that you can tailor it to suit your business and what you want to know. An example of this is if you are considering how you weight your content between desktop and mobile visitors. You can view a report (found in Tech – Tech Overview) which will compare your desktop visitors to your mobile visitors, as well as information about which browser the user is using, their operating system, and more. With this information, you can weigh up how much of your content or the design of your site is weighted between desktop and mobile visitors.
You can even take a look at the country that your visits are coming from, which is ideal if you want to target certain countries.

The demographics of your users
Google Analytics allows you to find out more information about what countries, cities etc that your users are coming from. In some cases, you can also track the age, gender, and language of your users.
This report can be found in Demographics – Demographics Overview.
Learn more about how visitors are getting to you
Not only is it important to learn more about the visitors to your site, but also how they are getting there. In fact, this really is a vital tool for making the most of your website, and is one that you should view on a regular basis.
This report can be found in Acquisition – Traffic Acquisition.
On this particular screen you will see:
- A graph that shows the total number of visits
- A bar chart that shows where these visitors came from
- A table that shows engagement, users and conversions for each channel
It is this information that can show you whether or not your marketing efforts are really paying off, and help you to compare which method is proving the most lucrative for your website.
The main channels that you will see within this overview are:
- Direct – those that have come from people actually typing in your website address
- Organic searches – visitors that have used a search engine to find you
- Paid searches – visitors that have come from paid ads, like Google AdWords
- Organic video – visitors who have followed a link from a video e.g YouTube etc
- Organic social – those that have come from social media
- Referral – visits that have been encouraged thanks to a link on another website
The areas of marketing that you choose to invest in are going to have a huge impact on the data delivered to you and you can tailor this to suit. Perhaps you already invest heavily in SEO, and want to make sure that it is worthwhile, or maybe you pay for AdWords, only you are not sure if they are giving you the results that you hoped for.

Which pages are the most popular?
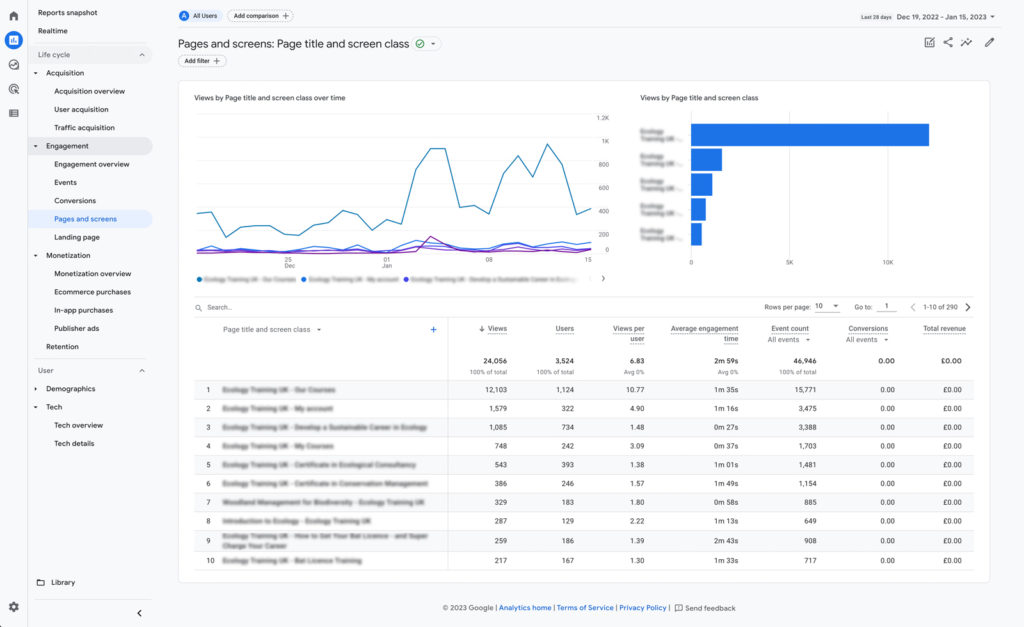
Lastly, Google Analytics can help you to understand more about which pages on your website are resonating the best with visitors. This information can be found at Engagement – Pages and scneens. The information that you can find within this particular section includes:
- The number of pages that have been visited
- The number of pages visited by the same visitor during the same visit
- The average amount of time that visitors are spending on your pages
- The amount of visitors that converted
- A table that shows the ascending order of pages, sorted by the number of times that someone has visited the page
Having this data to hand means that you can understand more about which pages on your website work best, and which ones may be letting you down. This may be a product page, a blog or perhaps another page that is being visited but not making an impression. Once you know where your downfall is, you can make steps to change it.

What next?
Hopefully you will have found this article useful, and once you have got your head around the basics you can delve deeper into the more statistical world that Google Analytics has to offer. The next thing to do is setup Google Tag Manager, which will allow you to track custom events and tracking, which requires a more technically advanced approach, however, once this is set up, you can use it to track contact form submissions, PDF downloads and even signups to your newsletter, as well as data on where those visits were generated from.
If you would like to discuss Google Analytics further, or any of our other digital marketing offering, please do drop us a line to have a chat (and a cookie #ShareTheCookieLove)! We’d be more than happy to help.


